Student Enrollment Continues to Decline
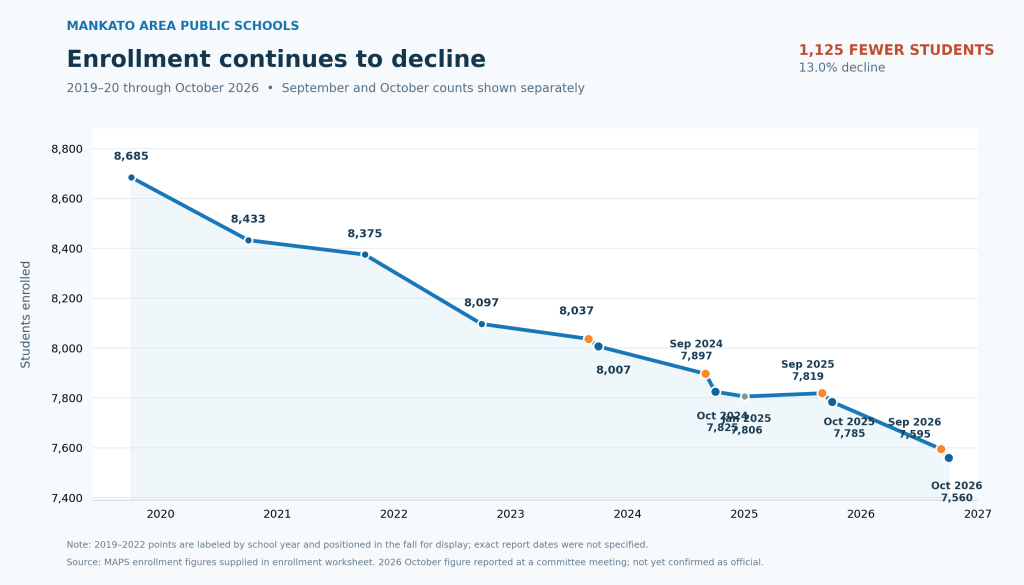
Updated enrollment figures through October 1, 2026, show that Mankato Area Public Schools continues to experience declining enrollment.
In the 2019–2020 school year, the district reported 8,685 students. The October 1, 2026 figure is now 7,560 students.
That represents a loss of 1,125 students, or approximately 13%, since the 2019–2020 school year.
Enrollment Change
- 1,125 fewer students since 2019–2020
- 13.0% decline from the 2019–2020 baseline
- 225 fewer students compared with October 2025
An Interesting Pattern: September vs. October
Looking at the last three years, another pattern emerges. In each year, reported enrollment has dropped between September and October.
| School year | September | October | Change |
|---|---|---|---|
| 2024–25 | 7,897 | 7,825 | −72 |
| 2025–26 | 7,819 | 7,785 | −34 |
| 2026–27 | 7,595 | 7,560 | −35 |
That is an average reduction of approximately 47 students between the September and October reports.
Why does enrollment consistently drop between September and October?
There may be several explanations.
One possibility is that September figures include students who are expected to attend but ultimately enroll elsewhere. Student transfers, moves, and withdrawals may not all be reflected in the earliest enrollment reports.
Another possibility is that families make enrollment decisions after the school year begins, choosing neighboring school districts, private schools, charter schools, or homeschooling.
It is also possible that some of the difference is simply administrative. September enrollment figures may be preliminary, while October 1 is Minnesota’s official enrollment reporting date.
These explanations are not mutually exclusive, and the enrollment numbers alone do not tell us which factors are responsible.
Why Is Enrollment Continuing to Decline?
Declining birth rates and demographic changes are certainly contributing factors, but they do not tell the entire story.
Mankato Area Public Schools is also experiencing a decline in student market share, meaning a smaller percentage of school-age children living within district boundaries are choosing to attend our public schools. This past year the market share stayed relatively stable with around 76% market share but that is a drop from 2018.
The district’s 119-page demographic study, dated January 2025 and presented at a summer School Board work session, examines these trends in greater detail, including student market share beginning around page 55.
Understanding the difference between having fewer school-age children in our community and having more families choose neighboring districts, charter schools, private schools, or homeschooling is essential.
Changing Enrollment Patterns: Where Are Mankato Families Choosing to Send Their Children?
While declining birth rates may explain some of the district’s enrollment losses, another important factor deserves attention: an increasing number of families living within Mankato Area Public Schools boundaries are choosing neighboring school districts.
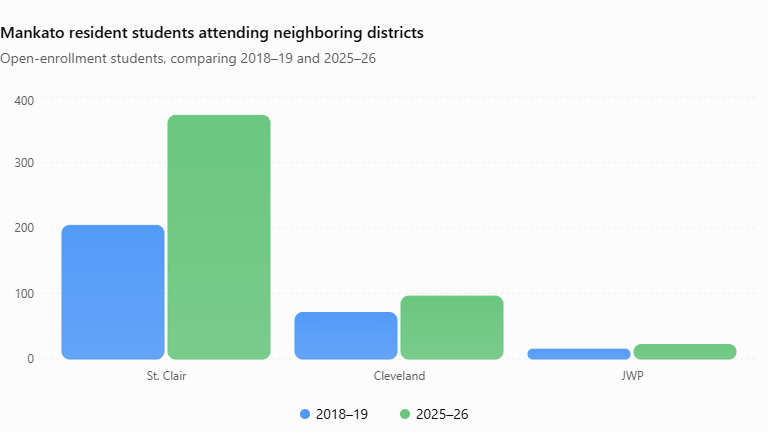
St. Clair has long attracted students from Mankato, but comparing the district’s 2018–19 and 2025–26 demographic reports reveals how significantly these enrollment patterns have changed.
- St. Clair: Increased from 204 to 372 Mankato resident students, an 82% increase.
- Cleveland: Increased from 71 to 96 students, a 35% increase.
- Janesville-Waldorf-Pemberton (JWP): Increased from 15 to 22 students, a 47% increase.
Combined, these three districts now enroll 490 students who reside within Mankato Area Public Schools boundaries, compared with 290 in 2018–19.
That is an increase of 200 students, or approximately 69%.
A Change in the District’s Assumptions
What makes this particularly interesting is that Mankato’s 2018–19 demographic report included the following enrollment projection assumption:
“Open enrollment and consolidation with other school districts will have minimal impact on the Mankato Area Public School populations.”
That assumption is no longer included in the 2025–26 demographic booklet.
The most significant finding
2018–19
386
Students open enrolling out
2025–26
925
Students open enrolling out
That is an increase of 539 outbound students, or approximately 140% in seven years.
And in 2018–19, the district’s net open-enrollment loss was only one student (385 in versus 386 out). By 2025–26, the net loss reached 629 students.
What Is Driving These Decisions?
These numbers raise important questions.
Why are more Mankato families choosing neighboring districts? Are families looking for smaller schools, different educational opportunities, stronger academic support, school safety, discipline, or simply a different school environment?
We should not assume every family is leaving for the same reason. But we also should not assume declining enrollment is primarily a demographic problem without examining the educational choices families are making.
The distinction matters: We cannot control how many children are born in our community, but we can listen to families and work to make our schools a place they want to choose.
As a school board member, I believe understanding these trends requires more than enrollment projections. We need meaningful feedback from families who have left, families considering leaving, and families who continue to choose Mankato Area Public Schools.
Sources:
Mankato Area Public Schools, 2025–26 Demographic Data, pp. 1 and 12.
Mankato Area Public Schools, 2018–19 Demographic Data, pp. 1 and 11.
Note: The October 1, 2026 enrollment figure of 7,560 was mentioned at a district Transportation Committee meeting and is pending confirmation against official enrollment records.
Sources
Mankato Area Public Schools enrollment reports, board meeting presentations, and district demographic study.ment figure: Reported at a district Transportation Committee meeting; official documentation pending confirmation.
Previous enrollment report, including district source links (September 19, 2026)
Minnesota Department of Education — Enrollment Count and Average Daily Membership


Leave a Reply