ISD 77 Student Enrollment
Reported enrollment from the 2019–2020 school year through September 2026
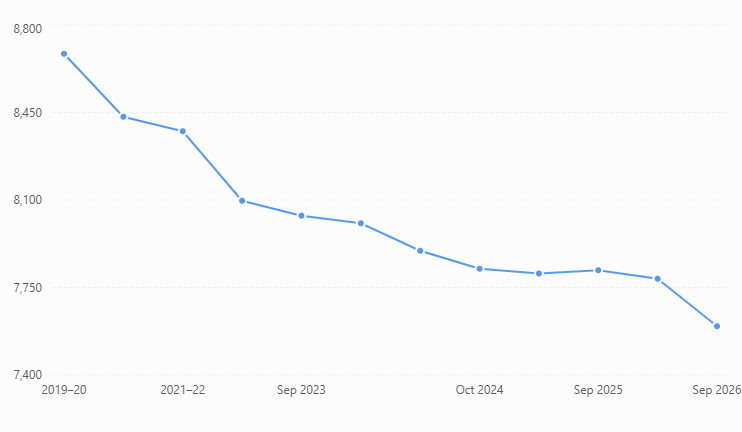
Source: The earliest four figures are labeled by school year; later figures are labeled by reporting month. The vertical axis begins at 7,400 to show changes more clearly.
Enrollment change
1,090
Fewer students since 2019–2020
12.6%
Decline from the 2019–2020 baseline
Source links for the graph
| Years | Enrollment |
| 2019-2020 | 8685 |
| 2020-2021 | 8433 |
| 2021-2022 | 8375 |
| 2022-2023 | 8097 |
| sept 1 2023 | 8037 |
| Oct 1st 2023 | 8007 |
| Sept.1st 2024 (about 15min into meeting) | 7,897 |
| Oct.1st 2024 | 7825 |
| Jan 1 2025 | 7806 |
| sept 1 2025 (about 11 minutes into meeting | 7819 |
| Oct 1st | 7,785 |
| Sept 8, 2026 at about (49 minutes in) | 7595 |
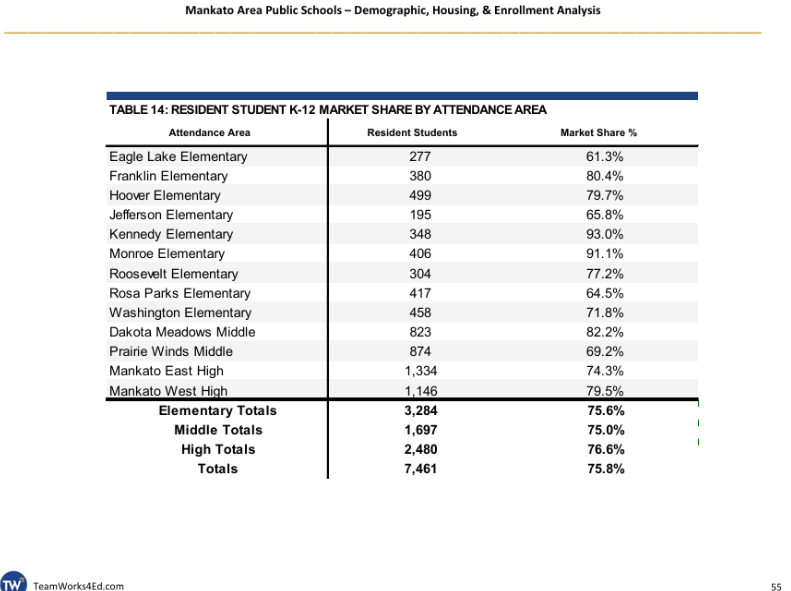
While declining birth rates and demographic changes contribute to lower enrollment, they do not tell the entire story. Mankato Area Public Schools is also experiencing a decline in market share, meaning a smaller percentage of school-age children living within district boundaries are attending our public schools. The district’s 119-page demographic study, dated January 2025 and presented at a summer School Board work session, examines these trends in greater detail, including student market share beginning around page 55. Understanding the difference between having fewer school-age children in our community and having more families choose neighboring districts, charter schools, private schools, or homeschooling is essential. We need to understand not only how many students we are losing, but why families are choosing other educational options and what the district can do to address their concerns.


Leave a Reply