Over the past several years, I have written about the importance of making school data easier for families, taxpayers, and community members to find and understand.
In my earlier post, “Finding the Facts: School Budgets, Enrollment, and Test Scores,” I shared MCA information along with links to state and district sources so people could look at the numbers themselves. Elizabeth Hanke for Mankato School Board I have also looked at how academic outcomes relate to spending at individual Mankato schools, while cautioning that school populations and student needs differ significantly. Elizabeth Hanke for Mankato School Board
The Minnesota Department of Education has now released updated results through 2026, so I wanted to update the data.
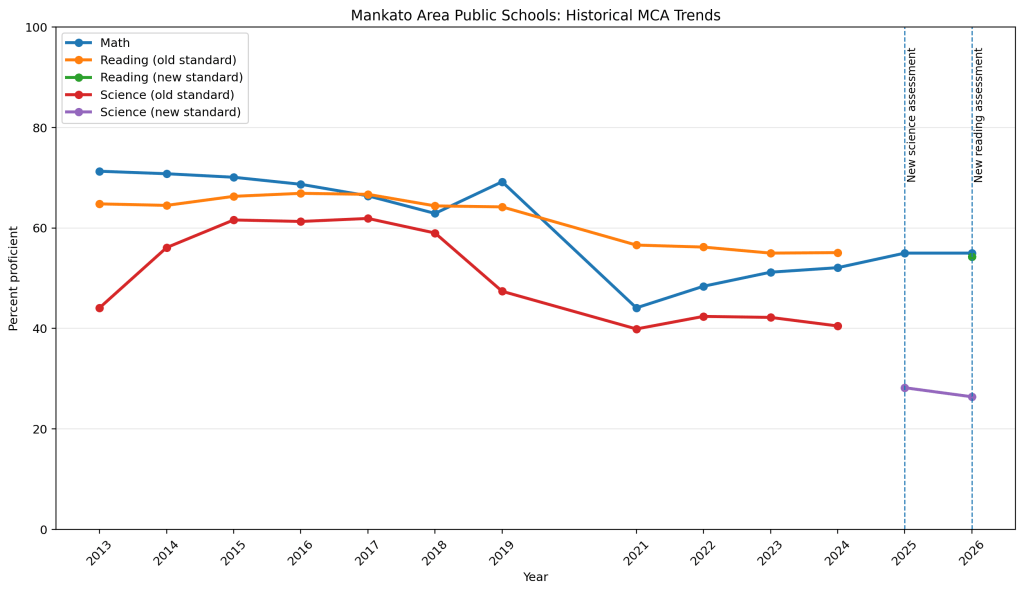
The most important caution is that not every subject can be compared continuously over time.
MDE states:
Beginning in 2025, there are new science assessments, so the trend line starts over. Beginning in 2026, there are new reading assessments, so the trend line starts over.
That means:
- Math provides the best continuous long-term trend.
- 2026 reading should be treated as a new baseline.
- Science can be compared from 2025 to 2026, but the new science assessment should not simply be connected to the pre-2025 science results.
Districtwide MAPS Results
The most recent Minnesota Report Card shows the following districtwide results:
| Subject | 2024 | 2025 | 2026 | Change 2025–26 |
|---|---|---|---|---|
| Math | 52.1% | 55.0% | 55.0% | 0.0 pts |
| Reading | — | — | 54.3% | New baseline |
| Science | — | 28.2% | 26.4% | −1.8 pts |
MDE reports that the 2026 district results represent 2,145 students in math, 2,202 in reading and 442 in science. export (15)
Long-Term Math Trend
Math is especially useful because it remains the subject for which we can look at the longest continuous trend.
My earlier MCA report tracked Mankato Area Public Schools back to 2013 and also explained which grades take the various MCA assessments. mca test scores
Using that earlier data together with the newest MDE figures, district math proficiency looks like this:
| Year | Math proficiency |
|---|---|
| 2013 | 71.3% |
| 2014 | 70.8% |
| 2015 | 70.1% |
| 2016 | 68.7% |
| 2017 | 66.4% |
| 2018 | 62.9% |
| 2019 | 69.2% |
| 2020 | No MCA |
| 2021 | 44.1% |
| 2022 | 48.4% |
| 2023 | 51.2% |
| 2024 | 52.1% |
| 2025 | 55.0% |
| 2026 | 55.0% |
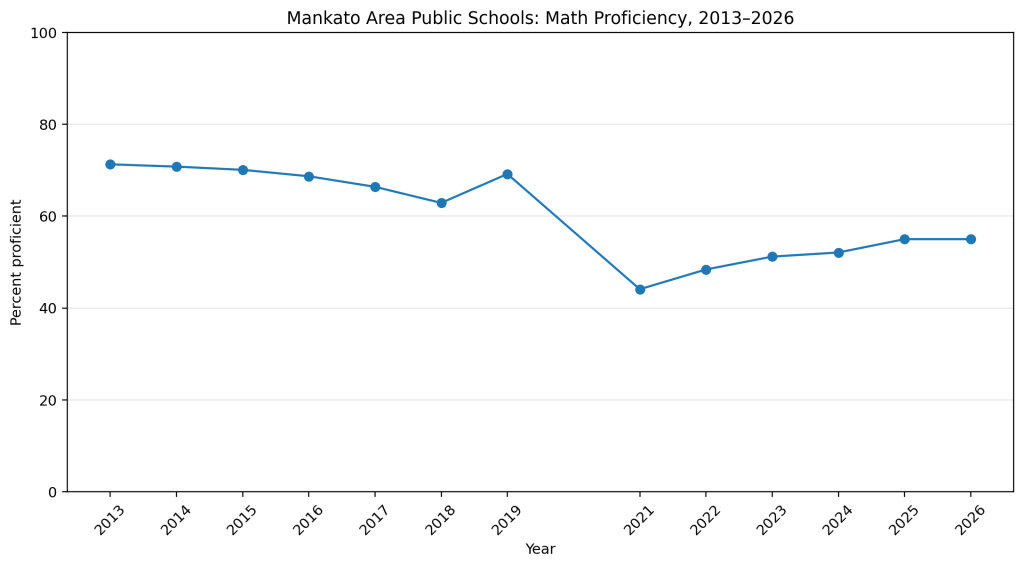
One small data note: for the updated graph I used the current Minnesota Report Card value of 51.2% for 2023, rather than carrying forward an older extraction if the two differed.
The larger pattern is clear: math proficiency fell sharply around the pandemic period and has made some recovery since 2021, but the 2026 rate remains below the levels seen a decade ago.
2013: 71.3%
2021: 44.1%
2026: 55.0%
That represents an increase of 10.9 percentage points since 2021, while remaining 16.3 points below 2013.
Individual Schools
Looking only at district averages can hide substantial differences among schools.
The table below uses the individual MDE school exports.
| School | Math 2025 | Math 2026 | Math change | Reading 2026* | Science 2025 | Science 2026 |
|---|---|---|---|---|---|---|
| Franklin | 76.0% | 67.3% | −8.7 | 61.5% | 27.5% | 20.0% |
| Rosa Parks | 54.1% | 50.0% | −4.1 | 43.4% | 16.5% | 14.5% |
| Washington | 70.8% | 75.2% | +4.4 | 60.7% | 18.2% | 23.6% |
| Eagle Lake | 83.5% | 77.6% | −5.9 | 61.2% | 38.1% | 36.0% |
| Monroe | 55.4% | 61.2% | +5.8 | 58.2% | 25.4% | 30.1% |
| Hoover | 62.6% | 70.2% | +7.6 | 58.5% | 15.2% | 15.1% |
| Bridges | 70.3% | 76.4% | +6.1 | 73.4% | 35.9% | 26.7% |
| Jefferson | 58.8% | 58.2% | −0.6 | 61.2% | 31.0% | 29.0% |
| Roosevelt | 68.6% | 72.0% | +3.4 | 62.2% | 33.3% | 42.9% |
| Kennedy | 77.7% | 68.6% | −9.1 | 58.3% | 21.7% | 32.7% |
| Dakota Meadows | 48.6% | 46.9% | −1.7 | 56.9% | 20.6% | 20.3% |
| Prairie Winds | 46.5% | 46.3% | −0.2 | 47.5% | 18.3% | 19.7% |
| Mankato East | 29.0% | 35.8% | +6.8 | 45.4% | 39.2% | 41.9% |
| Mankato West | 48.1% | 46.9% | −1.2 | 49.4% | 48.7% | 27.8% |
| Central | N/A | N/A | — | N/A | N/A | N/A |
*2026 reading is the first year of the new reading assessment and should be viewed as a new baseline.
| School | Math 2019 | Math 2021 | Math 2024 | Math 2025 | Math 2026 | Change 2019→2026 |
|---|---|---|---|---|---|---|
| Franklin | 83% | 71.5% | 80.0% | 76.0% | 67.3% | −15.7 |
| Rosa Parks | 54% | 54.1% | 46.6% | 54.1% | 50.0% | −4.0 |
| Washington | 61% | 52.2% | 73.1% | 70.8% | 75.2% | +14.2 |
| Eagle Lake | 74% | 62.8% | 82.4% | 83.5% | 77.6% | +3.6 |
| Monroe | 64% | 53.1% | 54.2% | 55.4% | 61.2% | −2.8 |
| Hoover | 74% | 54.8% | 56.4% | 62.6% | 70.2% | −3.8 |
| Bridges | 87% | 76.8% | 70.8% | 70.3% | 76.4% | −10.6 |
| Jefferson | 72% | 65.2% | 51.5% | 58.8% | 58.2% | −13.8 |
| Roosevelt | 63% | 44.3% | 71.2% | 68.6% | 72.0% | +9.0 |
| Kennedy | 67% | 56.5% | 76.7% | 77.7% | 68.6% | +1.6 |
| Dakota Meadows | 60% | 36.0% | 44.7% | 48.6% | 46.9% | −13.1 |
| Prairie Winds | 50% | 39.8% | 40.5% | 46.5% | 46.3% | −3.7 |
| Mankato East | —* | 33.1% | 30.2% | 29.0% | 35.8% | — |
| Mankato West | 51% | 49.8% | 48.6% | 48.1% | 46.9% | −4.1 |
Central’s results are not available in the Report Card data we reviewed, so I have left them as unavailable rather than attempting to estimate them.
Math: Some Schools Rose While Others Declined
Districtwide math stayed at 55.0%, but that flat district number masks movement at individual schools.
The largest increases from 2025 to 2026 included:
- Hoover: +7.6 points
- Mankato East: +6.8
- Bridges: +6.1
- Monroe: +5.8
- Washington: +4.4
- Roosevelt: +3.4
At the same time, several schools declined:
- Kennedy: −9.1
- Franklin: −8.7
- Eagle Lake: −5.9
- Rosa Parks: −4.1
Prairie Winds, Jefferson, West and Dakota Meadows were comparatively close to their prior-year results.
This is one reason I think building-level information matters. A single district average cannot show where improvement is occurring or where additional questions may be warranted.
Reading: 2026 New Baseline
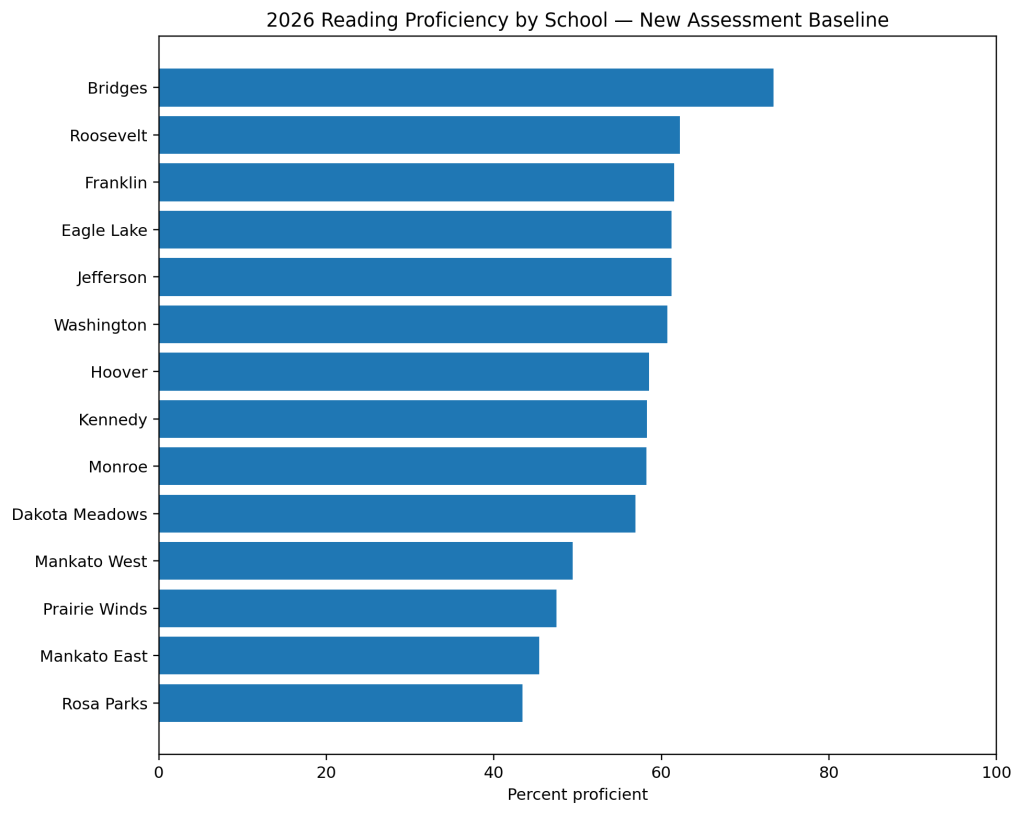
Because Minnesota introduced a new reading assessment in 2026, I do not think it would be responsible to draw a continuous line from the old reading test to the new one and call the difference an increase or decrease.
Instead, 2026 should be viewed as the starting point for future comparisons.
The districtwide reading proficiency rate was 54.3%.
Among individual schools in the data provided, 2026 reading proficiency ranged from:
73.4% at Bridges to 43.4% at Rosa Parks.
Other results included:
- Roosevelt — 62.2%
- Franklin — 61.5%
- Eagle Lake — 61.2%
- Jefferson — 61.2%
- Washington — 60.7%
- Hoover — 58.5%
- Kennedy — 58.3%
- Monroe — 58.2%
- Dakota Meadows — 56.9%
- West — 49.4%
- Prairie Winds — 47.5%
- East — 45.4%
These should not be treated as a simple ranking of school quality. Grade configurations, student populations, special education needs and other factors differ among buildings. But the results do establish a baseline we can follow in the coming years.
Science: The New Assessment Two Years Old
Science restarted with a new assessment in 2025, which means we can now make our first direct year-to-year comparison under the new science assessment.
Districtwide:
2025: 28.2%
2026: 26.4%
That is a decrease of 1.8 percentage points. export (15)
At the school level, there was considerable variation.
Some of the larger increases included:
- Kennedy: +11.0 points
- Roosevelt: +9.6
- Washington: +5.4
- Monroe: +4.7
- Mankato East: +2.7
The largest decrease in the data was at Mankato West, where science proficiency moved from 48.7% in 2025 to 27.8% in 2026, a 20.9-point change.
Bridges declined from 35.9% to 26.7%, while Franklin moved from 27.5% to 20.0%.
Those changes are significant enough that I think they are worth understanding more deeply rather than drawing conclusions from one number alone.
What Should We Ask Next?
In a previous post about school spending and academic outcomes, I wrote that the value of public data is not simply identifying which school spends more or which percentage is higher. It gives us a starting point for asking better questions. Elizabeth Hanke for Mankato School Board
The same is true here.
Questions I think are worth asking include:
- Why are some schools seeing sustained improvement in math while others are moving in the opposite direction?
- Are particular instructional practices producing stronger results?
- How much do student mobility, absenteeism, class size and demographics explain the differences?
- Are interventions reaching students early enough?
- What can schools learn from one another?
- What explains particularly large one-year changes?
- As the new reading and science assessments establish longer trends, are students progressing?
One year of data should not determine how we view a school, teacher or group of students.
But neither should we ignore trends.
Data Should Help Us Ask Better Questions
I have consistently advocated for making measurable information available to the public.
That does not mean every number tells us why something happened.
It means families, educators and School Board members should have enough information to recognize trends, ask questions and determine whether programs and interventions are producing the outcomes we hoped for.
The district’s math results have improved considerably from the 2021 low, although they have not returned to the levels seen before the pandemic or a decade ago.
Reading now has a new baseline.
Science has two years under its new assessment, giving us the beginning of a new trend.
I plan to continue following these results as additional years of comparable data become available.
Sources
The school-level and district-level 2025–2026 figures in this post come directly from the Minnesota Department of Education Minnesota Report Card, retrieved October 2, 2026.
My earlier background posts include Finding the Facts: School Budgets, Enrollment, and Test Scores and What Does It Cost to Educate a Student at Each Mankato School? FY24. Elizabeth Hanke for Mankato School Board


Leave a comment