Fewer Students, Larger Classes: What 22 Years of Mankato School Data Tells Us About Enrollment, Funding, and Educational Priorities
October 2026
Mankato Area Public Schools has experienced years of declining enrollment. Yet, despite having fewer students, our average elementary class sizes are increasing. Why?
That question led me to review more than two decades of our district’s demographic reports, dating back to the 2003–04 school year.
What I found raises important questions about how our district allocates resources, how enrollment losses affect classroom funding, and whether we are doing enough to protect the educational experience of the students who remain.
There is another important piece to this discussion: Minnesota law specifically directs a portion of school funding toward reducing class sizes in kindergarten through third grade.
I believe these issues deserve a much closer look.
1. What Does 22 Years of Class-Size Data Show?
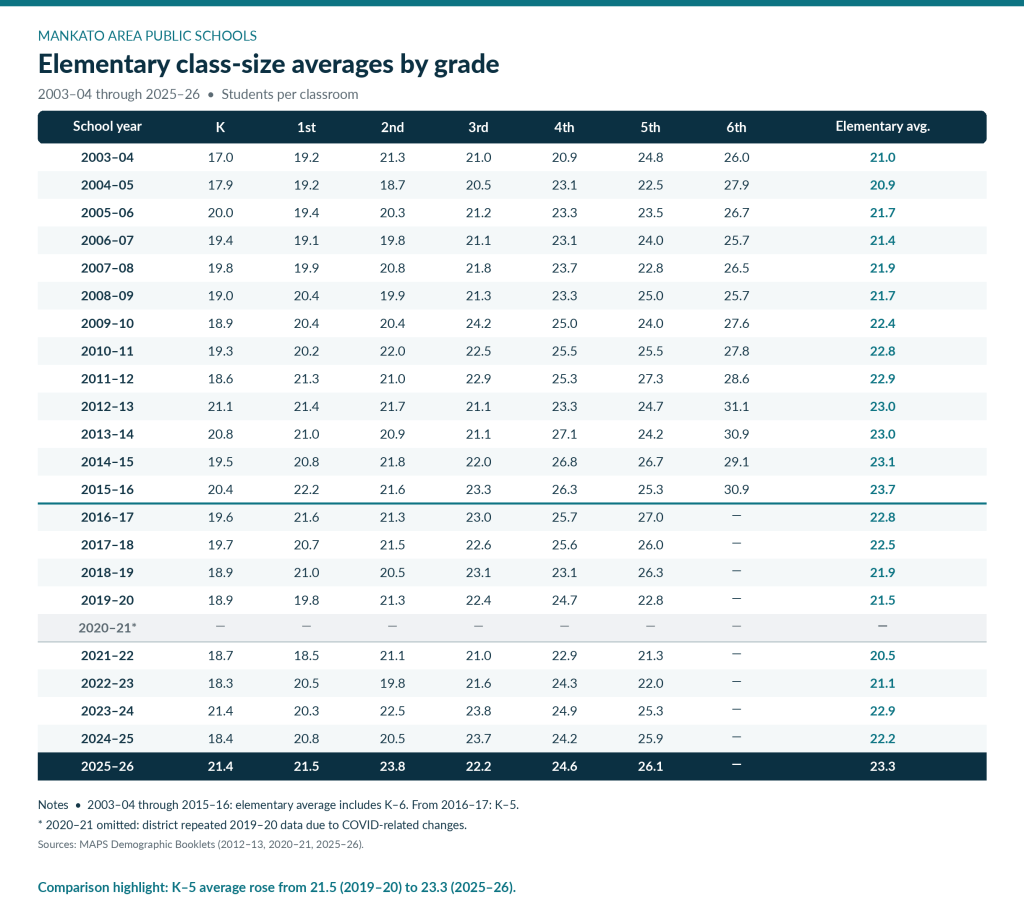
Our district’s demographic reports provide elementary class-size averages dating back to 2003–04.
Here are several important points in that history:
| School Year | Average Class Size |
|---|---|
| 2003–04 | 21.0 |
| 2008–09 | 21.7 |
| 2012–13 | 23.0 |
| 2015–16 | 23.7 |
| 2016–17 | 22.8 |
| 2019–20 | 21.5 |
| 2021–22 | 20.5 |
| 2022–23 | 21.1 |
| 2023–24 | 22.9 |
| 2024–25 | 22.2 |
| 2025–26 | 23.3 |
Important note: The district’s elementary average included kindergarten through sixth grade before sixth grade transitioned to middle school beginning in 2016–17. Later averages reflect K–5. These periods should not be treated as perfectly comparable. The district also reused 2019–20 class-size data in its 2020–21 booklet because pandemic conditions made that year’s actual figures unusually low.
Even with those qualifications, the more recent trend is clear.
In the last six years, using the same K–5 grade span, average elementary class sizes have increased from 21.5 students in 2019–20 to 23.3 students in 2025–26.
That represents an 8.4% increase.
2. Which Grades Are Experiencing the Largest Increases?
Looking at the districtwide average is useful, but the breakdown by grade tells an even more interesting story.
| Grade | 2019–20 | 2025–26 | Change |
|---|---|---|---|
| Kindergarten | 18.9 | 21.4 | +2.5 |
| 1st Grade | 19.8 | 21.5 | +1.7 |
| 2nd Grade | 21.3 | 23.8 | +2.5 |
| 3rd Grade | 22.4 | 22.2 | −0.2 |
| 4th Grade | 24.7 | 24.6 | −0.1 |
| 5th Grade | 22.8 | 26.1 | +3.3 |
| Elementary Average | 21.5 | 23.3 | +1.8 |
Fifth grade stands out.
The average fifth-grade classroom has increased from 22.8 students before the pandemic to 26.1 students today, an increase of approximately 14.5% from 2019 to 2025.
Kindergarten and second grade have also experienced notable increases.
Third and fourth grade averages have remained relatively stable over this particular period.
And remember, these are averages, not maximum classroom sizes.
3. Minnesota Law Specifically Addresses Elementary Class Sizes
One particularly interesting finding involves Minnesota Statute 126C.12, which addresses Learning and Development Revenue.
This law requires school districts to reserve a portion of their general education revenue for class-size reduction.
For fiscal year 2026, the statutory calculation is:
- $299 multiplied by kindergarten average daily membership.
- $459 multiplied by average daily membership in grades 1–6.
Under the law, this reserved revenue is directed toward reducing and maintaining districtwide average class sizes in kindergarten through third grade at 17 students per classroom teacher.
The law also addresses how the district may use the revenue once that average is achieved and requires annual reporting of class-size ratios to the Minnesota Department of Education.
Now compare that 17:1 statutory target with Mankato’s reported 2025–26 numbers:
| Grade | Statutory Target | MAPS Average |
|---|---|---|
| Kindergarten | 17 | 21.4 |
| Grade 1 | 17 | 21.5 |
| Grade 2 | 17 | 23.8 |
| Grade 3 | 17 | 22.2 |
Every one of these grades is above the 17:1 level described in the statute.
This does not, by itself, establish that the district is violating state law. The statute concerns the use of designated revenue, and determining compliance requires reviewing how those dollars were allocated and spent.
But I believe it raises several important questions.
How much Learning and Development Revenue does MAPS reserve each year for reducing class sizes? Where is that funding being used, and what results are we achieving?
4. Declining Enrollment Means Declining Revenue
To understand classroom staffing, we must also understand how Minnesota funds its public schools.
Our state provides districts with a substantial portion of their operating funding based on student enrollment.
For the 2024–25 school year, Minnesota’s basic general education formula allowance was $7,281 per adjusted pupil unit.
For 2025–26, that increased to $7,481.
An adjusted pupil unit is not always equivalent to one individual student. Minnesota applies enrollment weights, and districts receive several additional sources of revenue beyond the basic formula.
But the central point remains:
When enrollment declines, the district generally loses revenue associated with those students.
Consider a simplified example.
If a district loses 100 adjusted pupil units, that represents approximately $748,100 in annual basic formula revenue at the FY2026 rate, before considering other funding formulas and adjustments.
Minnesota does provide declining-enrollment revenue, which partially offsets eligible year-over-year enrollment decreases. Under the current formula, that adjustment is calculated using 28% of the basic allowance and the decline in adjusted pupil units.
But the adjustment does not replace all the revenue associated with the students who are no longer enrolled.
And the financial effects do not end with the basic formula. Other revenue categories, including local operating revenue, can also depend on pupil counts.
This is why student enrollment is so important to a school district’s long-term financial stability.
5. How Much Enrollment Has Mankato Lost?
The district’s 2025 Annual Comprehensive Financial Report provides historical enrollment information measured through average daily membership.
It reports:
- Fiscal Year 2020: 8,809 students
- Fiscal Year 2025: 7,890 students
That represents a decline of 919 students, or approximately 10.4%, using the report’s enrollment measure.
The subsequent 2025–26 demographic booklet reports 7,785 students in its October 1 enrollment count. That is a different reporting date and measure, so it should not be directly substituted into the audited enrollment series.
Regardless, the direction is clear: MAPS is educating substantially fewer students than it was several years ago.
One reason we hear for declining enrollment is smaller kindergarten classes resulting from lower birth rates.
That certainly deserves consideration.
But lower birth rates are not the only enrollment issue facing Mankato.
Families are also making different educational choices.
6. Open Enrollment Has Changed Dramatically
One of the most concerning enrollment trends involves the number of students leaving MAPS for other public school districts.
According to our historical demographic reports, in 2012–13, the district recorded 423 students attending MAPS from outside districts and 240 MAPS residents attending other districts under open enrollment and nonresident agreements.
That produced a net gain of 183 students.
By 2025–26, the district’s open-enrollment report showed:
- 296 students enrolling into MAPS from other districts.
- 925 MAPS resident students attending other public school districts.
- A net loss of 629 students.
The two historical reports use somewhat different program descriptions, so I would want those definitions verified before treating the comparison as a precise measure of change.
Nevertheless, the overall movement is striking.
Some of the largest current losses include:
- St. Clair: 372 students out, 54 in, for a net loss of 318.
- Cleveland: 96 students out, 14 in, for a net loss of 82.
- Minnesota Transitions: 106 students out, this is an online charter school.
- St. Peter: 79 students out, 29 in, for a net loss of 50.
MAPS does experience gains from some neighboring districts, including Lake Crystal Wellcome Memorial.
It is also important to recognize that these counts represent enrollment choices at a point in time, not necessarily students who personally transferred out during that particular year.
But they illustrate that enrollment competition has become a significant financial and educational issue.
7. Why Are Families Choosing Other Schools?
I believe this is one of the most important questions we should be asking.
There are many legitimate reasons families choose schools.
Some move. Some prefer private or religious education. Some need a different instructional environment. Others choose homeschooling, online programs, or smaller school districts.
Our 2025–26 demographic booklet reports 966 resident students attending nonpublic schools and another 228 students being homeschooled.
Those numbers demonstrate the range of educational choices available to families. They do not, by themselves, reveal why each family made its decision.
However, in my conversations with parents and educators, I frequently hear concerns about school discipline, classroom disruptions, bullying, academic expectations, and whether families feel listened to.
One theme I hear repeatedly from families considering smaller districts is that they want their children to feel like more than just a number.
I also hear that some families find it easier to build relationships with school leadership in smaller districts.
That does not mean smaller schools are free from discipline or academic challenges. I have heard mixed experiences from families in neighboring districts as well.
But perceptions matter when families are making enrollment decisions.
As a district, I believe we should be asking whether there are concerns within our control that could be addressed to help families feel more confident about choosing MAPS.
Every family we retain supports both our educational community and the financial resources available to serve students.
8. Why Can Classroom Sizes Increase While Enrollment Decreases?
This is where the relationship between school funding and staffing becomes especially important.
Imagine an elementary grade with 100 students divided into four classrooms.
That would average 25 students per classroom.
Now imagine that enrollment drops to 90 students.
If the school keeps four classrooms, the average drops to 22.5 students.
But if budget pressures lead the school to reduce staffing to three classrooms, the average increases to 30 students.
When fewer students generate fewer dollars, schools may be pressured to reduce teaching positions or consolidate classroom sections.
The district must also continue paying expenses that do not disappear when a handful of students leave, including building operations, transportation, utilities, instructional materials, and administrative functions.
It is not always possible to reduce those costs in the same proportion as enrollment.
The critical question becomes where the district chooses to make reductions.
Do we reduce classroom teaching positions? Do we adjust programs? Do we reorganize facilities? Do we reduce other operating expenses?
Those decisions directly influence what students experience.
9. What Do Our Staffing Numbers Show?
The district’s Annual Comprehensive Financial Report also contains a ten-year table of employees by classification.
That report shows the number of teachers declining from 732 in fiscal year 2020 to 647 in fiscal year 2025. (Page 143)
That is 85 fewer teachers, or approximately an 11.6% decrease.
During the same period, the report’s enrollment series declined from 8,809 to 7,890 students, approximately 10.4%.
These figures are important, but they have limitations.
The employee table counts people by contract classification, not full-time-equivalent elementary classroom teachers. It includes staff across grade levels and programs, and full-time and part-time employees are counted equally.
Therefore, these figures cannot establish whether the number of elementary classroom sections or classroom teacher FTEs declined faster than elementary enrollment.
That is exactly the information I would like to examine next.
Have elementary classroom teaching positions declined more rapidly than elementary enrollment?
And if so, which staffing and budget decisions contributed to that change?
Those answers would help us understand whether larger class sizes are an unavoidable consequence of changing enrollment or whether there are opportunities to make different decisions.
10. How Much Does MAPS Spend Per Student?
Another important distinction is the difference between funding per pupil and spending per pupil.
Minnesota’s $7,481 basic formula allowance is only one part of school revenue.
Districts also receive funding for special education, pupil needs, transportation, local operating levies, federal programs, and other purposes.
The district’s 2025 financial report provides a useful comparison using fiscal year 2024 expenditures per student.
| General Fund Spending per Student, FY2024 | Minnesota Average | MAPS |
|---|---|---|
| Regular Instruction | $6,524 | $5,945 |
| Special Education | $3,187 | $3,239 |
| Instructional Support | $842 | $618 |
| District-Level Administration | $848 | $372 |
| Total General Fund | $16,650 | $14,879 |
According to this report, MAPS spent approximately $1,771 less per student in total general fund expenditures than the statewide average.
For regular instruction, MAPS spent approximately $579 less per student.
These are actual expenditure comparisons, not the state funding formula or a current FY2026 budget.
Spending less is not automatically bad. Efficient operations should be encouraged, and districts differ in student needs, facilities, transportation, and programs.
But these figures deserve consideration when we are asking whether sufficient resources are making it into classrooms.
It would be useful to understand which expenditure differences reflect efficient operations, which reflect different student needs, and which may affect educational services.
I would also like to see the same analysis using the most recent available expenditure data.
11. Are We Using Our Buildings and Resources Efficiently?
There is another interesting figure in the 2025–26 demographic booklet.
The district reports elementary enrollment of 3,429 students against an estimated capacity of 5,862, representing approximately 58% building capacity utilization.
Some buildings are operating at substantially lower reported capacity percentages than others.
These figures should be interpreted carefully. Building-capacity estimates are based on planning assumptions, and the district’s published capacity figures have changed over time. This does not mean 42% of our actual classrooms are sitting empty and available for immediate use.
Still, it is a reasonable subject for further discussion.
As enrollment changes, how do we balance building costs with the goal of preserving neighborhood schools and classroom staffing?
I believe neighborhood schools provide enormous value.
There is something important about children walking to school with neighborhood friends, families getting to know one another, and parents building relationships with teachers and administrators.
Those relationships are part of what makes public education meaningful.
At the same time, we have a responsibility to understand how much we are spending to operate our buildings and whether those costs affect the resources available for classroom instruction.
These are difficult decisions, but avoiding the discussion does not eliminate the financial pressures.
12. What Should Our Priority Be?
Class size is not the only measure of educational quality.
A well-supported teacher with 25 students can provide an excellent education, while a classroom with fewer students can still struggle with discipline, instruction, or student achievement.
Student needs, instructional support, classroom culture, and teacher experience all matter.
But that does not make class size irrelevant.
Teachers must divide their time and attention among the students they serve.
Larger classes can make it more challenging to provide individualized instruction, especially when students have very different academic or behavioral needs.
Conclusion: Our Challenge Is Bigger Than Balancing the Budget
Reviewing these reports has reinforced something I believe is extremely important.
Mankato Area Public Schools has lost a substantial number of students, yet the average elementary classroom has grown larger in recent years.
Meanwhile, the district faces the financial consequences of reduced enrollment funding, significant building and operating obligations, and continued competition from other educational options.
None of these issues has an easy solution.
But the questions are important.
Every student who leaves our district represents more than a reduction in funding. They represent a family that has chosen a different educational path, and an opportunity for us to ask what we can learn from that decision.
Our job is not simply to manage a smaller district.
It is to make Mankato Area Public Schools a place where families want to send their children, teachers feel supported, and students have every opportunity to succeed.
That requires thoughtful budgeting, responsible stewardship of taxpayer resources, meaningful community engagement, and a clear commitment to what happens inside our classrooms.
I believe the community deserves those conversations, supported by data.
Sources
The analysis is based on district-published information and Minnesota school-finance law:
- MAPS 2012–13 Demographic Booklet — Elementary Class Size Averages, page 7, and Open Enrollment, pages 13–16.
- MAPS 2020–21 Demographic Booklet — Elementary Class Size Averages, page 8.
- MAPS 2025–26 Demographic Booklet — Building Capacity, page 5; Class Sizes, page 6; Open Enrollment, pages 12–13b; and Nonpublic School and Homeschool Enrollment, pages 14–15.
- MAPS FY2025 Annual Comprehensive Financial Report — Employee Classifications, page 127; Student Enrollment, page 131; and Expenditures per Student, page 132.
- Minnesota Statute 126C.12 — Learning and Development Revenue.
- Minnesota Statute 126C.10 — General Education Revenue.
- Minnesota House Research — School Finance Guide, November 2025.


Leave a Reply