K-12 Enrollment Trends, Mankato Area Public School in Minnesota 2019 to Oct 2025
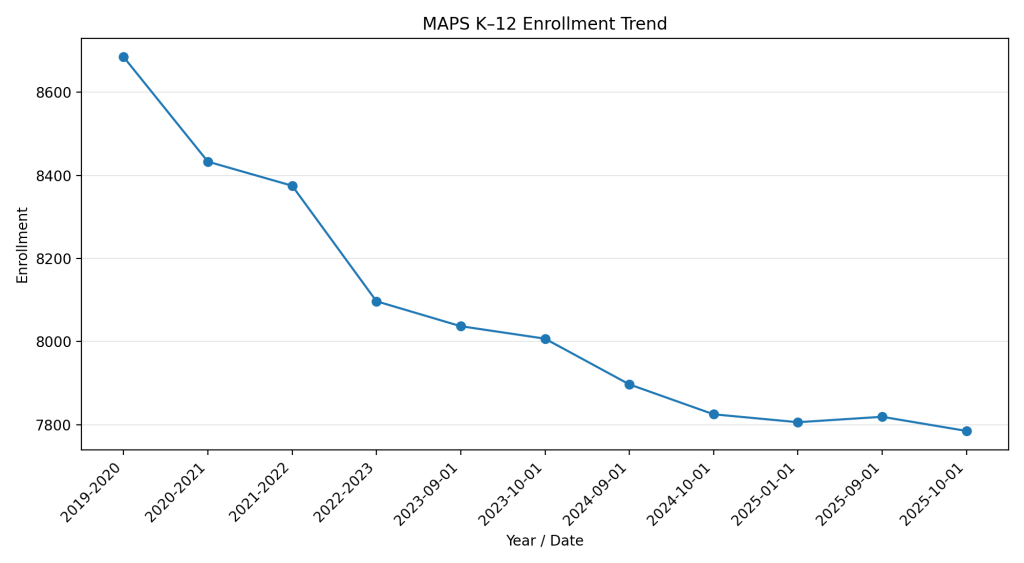
Since 2019–2020, enrollment has declined by roughly 900 students (~10%), with the most recent data suggesting the pace of decline may be slowing; but not yet reversing.
Any underlined years are linked to sources:
| Years | Enrollment |
| 2019-2020 | 8685 |
| 2020–2021 | 8433 |
| 2021-2022 | 8375 |
| 2022-2023 | 8097 |
| sept 1 2023 | 8037 |
| Oct 1st 2023 | 8007 |
| Sept.1st 2024 (about 15min into meeting) | 7,897 |
| Oct.1st 2024 | 7825 |
| Jan 1 2025 | 7806 |
| sept 1 2025 (about 11 minutes into meeting | 7819 |
| Oct 1st | 7,785 |
In Minnesota, funding largely follows the student. Fewer students means less revenue, even as costs continue to rise. This creates a structural challenges.
You’ll notice multiple enrollment dates (Sept. 1, Oct. 1, Jan. 1). The most important number for funding purposes is the October 1 count, which is why I’ve included it consistently. Other dates help show movement throughout the year.

Leave a comment