📊 ISD 77 Mankato Trends in Funding, 2015 to 2025
Over the past decade, total funding has increased, but the composition has shifted significantly. Property taxes have risen more than three times faster than state aid, meaning a growing share of school funding is coming from local taxpayers rather than the state.
Key Takeaways
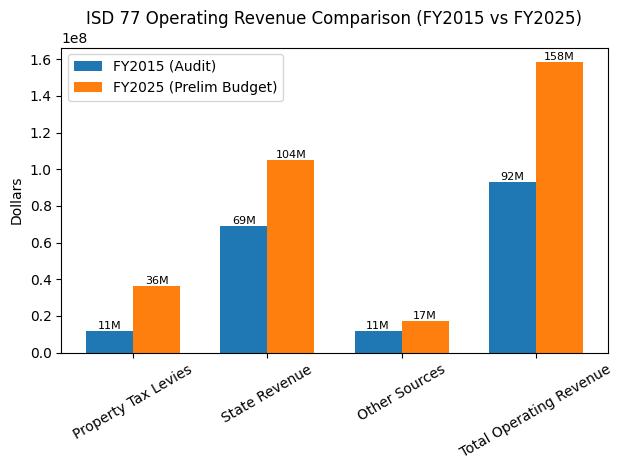
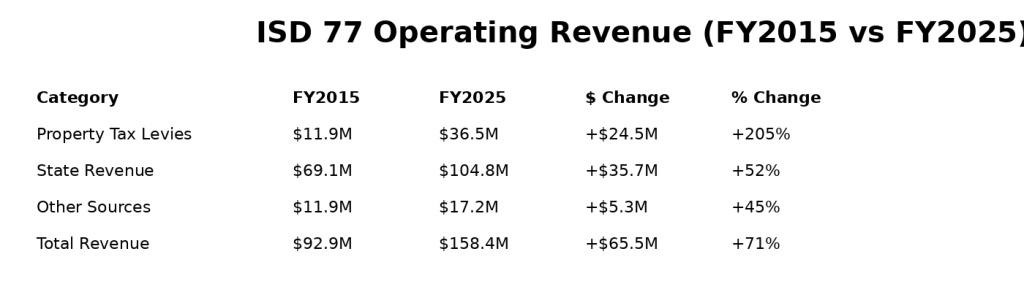
- Total operating revenue has increased by ~70%
However, when adjusted for inflation, that growth is significantly reduced, as the cost of operating schools has risen substantially over the same period. - Property tax revenue has increased by ~205%
Local taxpayers are contributing a much larger share of school funding than they were a decade ago. - State funding has increased by ~52%
State aid has grown, but not at the same pace as local funding or rising costs. - All other revenue sources have increased by ~44%
These include federal and miscellaneous funds, which have seen more modest growth. - Inflation has increased roughly ~35–40% over this period
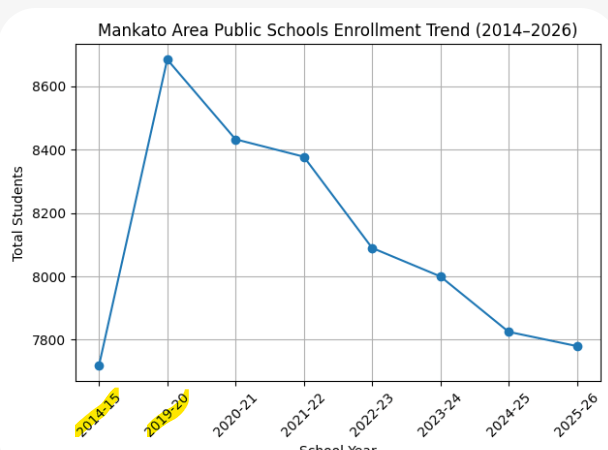
- Student enrollment has remained essentially flat from 2015 to 2025
However, this masks an important trend: enrollment grew to a peak around 2019–20 and has declined meaningfully in recent years. As a result, the district is now serving fewer students than just a few years ago, while operating in a higher-cost environment—putting upward pressure on cost per student.
These totals are reconstructed directly from the Mankato Area Public School district’s own financial documents, by summing revenues across the General, Food Service, and Community Service funds, ensuring an apples-to-apples comparison across years. You can find the districts financial statements at: https://www.isd77.org/experience/departments/business-services
I’m using publicly available data to better understand long-term trends in our district. While I serve on the ISD 77 School Board, this analysis is my own independent effort and not a formal board position. I am not an accountant or financial professional, and I’m continuing to learn as I go. If you see a better way to interpret the data, or think I should be looking at it differently, I welcome your feedback. Even better, please share your approach. This is complex work, and I appreciate others who are willing to engage thoughtfully.
Over the past decade, ISD 77’s total revenue has increased, but rising costs tell a more complete story. Since peaking in 2019–20, enrollment has fallen. Meanwhile, property taxes have grown much faster than state aid, placing more of the burden on local taxpayers. These combined pressures help explain why the district continues to face financial challenges despite increases in total funding.
The Math 2015:
1️⃣ Property Taxes
From the 2015 audit:
- General Fund: $11,084,481
- Community Service Fund: $860,209
- Food Service Fund: $0
Add them: 11,944,690
2️⃣ State Sources
From the audit:
- General Fund: $67,500,702
- Food Service: $201,790
- Community Service: $1,348,155
Add them: 69,050,647
3️⃣ Other Sources
This is where it gets messy—but important.
“Other Sources” = everything NOT:
- property tax
- state aid
So it includes:
✔ Federal revenue
✔ Fees (meals, community ed, etc.)
✔ Miscellaneous/local revenue
✔ Investment earnings
From all three funds combined:
👉 Total = $11,901,743
👉 In this example I include Community Service Fund property taxes because I am measuring total taxpayer burden
👉 This example does not match up for MDE’s “Combined Levies” or classroom funding
The Math 2025/26
1️⃣ Property Taxes
From the FY2026 Preliminary Budget (Operating Funds breakdown):
- General Fund: $33,820,000 (approx. from General Fund levy lines)
- Community Service Fund: $2,648,575
- Food Service Fund: $0
Add them: $36,468,575
2️⃣ State Sources
From the FY2026 Preliminary Budget:
- General Fund: $100,900,000 (approx. state aid lines combined)
- Food Service Fund: $450,000
- Community Service Fund: $3,422,833
Add them: 104,772,833
3️⃣ Other Sources
Same definition as before:
👉 Everything that is NOT:
- Property tax
- State aid
Includes:
✔ Federal revenue
✔ Fees (food service, community ed, childcare)
✔ Miscellaneous/local revenue
✔ Investment earnings
From FY2026 Budget (by fund):
General Fund:
- Federal + local + misc ≈ $13,500,000
Food Service:
- Federal + sales ≈ $4,200,000
Community Service:
- Fees + local ≈ $1,503,213
Add them:19,203,213
⚠️ BUT the district summary reports:
👉 $17,203,213
Why the difference?
Because:
- Some internal transfers / adjustments
- Some revenue categories excluded from “operating summary”
- Rounding / grouping differences in the budget book
For audit-grade consistency I used:
✅ Use the official summary total: $17,203,213
For student K-12 enrollment numbers:
From the 2014/15 Demographic report: 7718
From the 2025/26 Demographic Report: 7785

Leave a comment