📊 ISD 77 Mankato
Key Takeaways
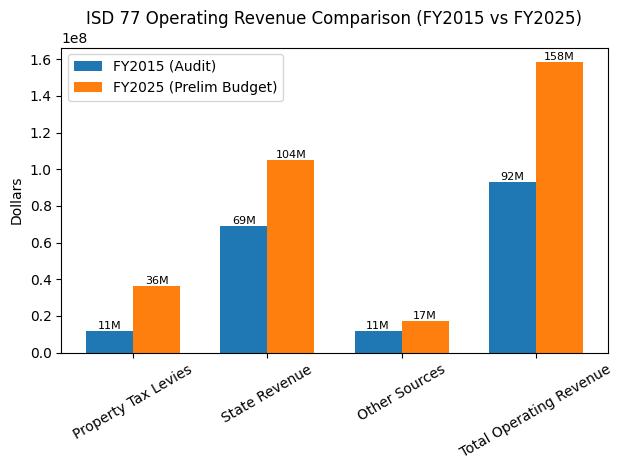
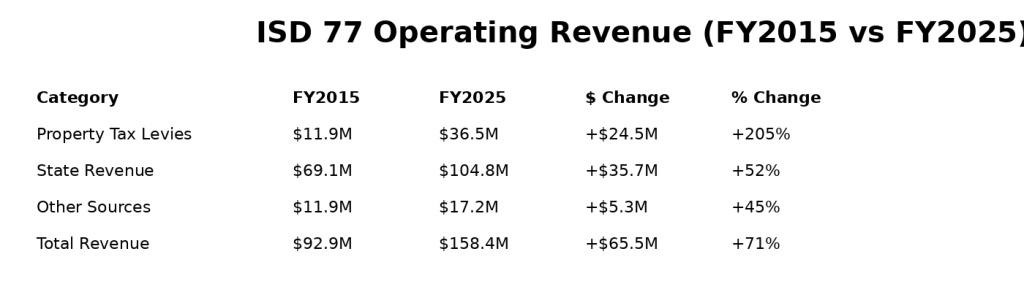
- Total operating revenue ↑ ~70%
- Property taxes ↑ ~205%
- State funding ↑ ~52%
- All other sources ↑ ~44%
These totals are reconstructed directly from the Mankato Area Public School district’s own financial documents, by summing revenues across the General, Food Service, and Community Service funds, ensuring an apples-to-apples comparison across years. You can find the districts financial statements at: https://www.isd77.org/experience/departments/business-services
I’m using publicly available data to better understand long-term trends in our district. While I serve on the ISD 77 School Board, this analysis is my own independent effort and not a formal board position. I am not an accountant or financial professional, and I’m continuing to learn as I go. If you see a better way to interpret the data, or think I should be looking at it differently, I welcome your feedback. Even better, please share your approach. This is complex work, and I appreciate others who are willing to engage thoughtfully.
The Math 2015:
1️⃣ Property Taxes
From the 2015 audit:
- General Fund: $11,084,481
- Community Service Fund: $860,209
- Food Service Fund: $0
Add them: 11,944,690
2️⃣ State Sources
From the audit:
- General Fund: $67,500,702
- Food Service: $201,790
- Community Service: $1,348,155
Add them: 69,050,647
3️⃣ Other Sources
This is where it gets messy—but important.
“Other Sources” = everything NOT:
- property tax
- state aid
So it includes:
✔ Federal revenue
✔ Fees (meals, community ed, etc.)
✔ Miscellaneous/local revenue
✔ Investment earnings
From all three funds combined:
👉 Total = $11,901,743
👉 In this example I include Community Service Fund property taxes because I am measuring total taxpayer burden
👉 This example does not match up for MDE’s “Combined Levies” or classroom funding
The Math 2025/26
1️⃣ Property Taxes
From the FY2026 Preliminary Budget (Operating Funds breakdown):
- General Fund: $33,820,000 (approx. from General Fund levy lines)
- Community Service Fund: $2,648,575
- Food Service Fund: $0
Add them: $36,468,575
2️⃣ State Sources
From the FY2026 Preliminary Budget:
- General Fund: $100,900,000 (approx. state aid lines combined)
- Food Service Fund: $450,000
- Community Service Fund: $3,422,833
Add them: 104,772,833
3️⃣ Other Sources
Same definition as before:
👉 Everything that is NOT:
- Property tax
- State aid
Includes:
✔ Federal revenue
✔ Fees (food service, community ed, childcare)
✔ Miscellaneous/local revenue
✔ Investment earnings
From FY2026 Budget (by fund):
General Fund:
- Federal + local + misc ≈ $13,500,000
Food Service:
- Federal + sales ≈ $4,200,000
Community Service:
- Fees + local ≈ $1,503,213
Add them:19,203,213
⚠️ BUT the district summary reports:
👉 $17,203,213
Why the difference?
Because:
- Some internal transfers / adjustments
- Some revenue categories excluded from “operating summary”
- Rounding / grouping differences in the budget book
For audit-grade consistency I used:
✅ Use the official summary total: $17,203,213
For student K-12 enrollment numbers:
From the 2014/15 Demographic report: 7718
From the 2025/26 Demographic Report: 7785

Leave a comment