After sharing the 2025–26 Mankato Area Public Schools demographic data, I received a number of thoughtful questions. This blog is designed to make the data more understandable and meaningful for our community. The 2025–26 enrollment figures reflect a snapshot of students enrolled in the district as of October 1, 2025.
Enrollment: A Clear Downward Shift
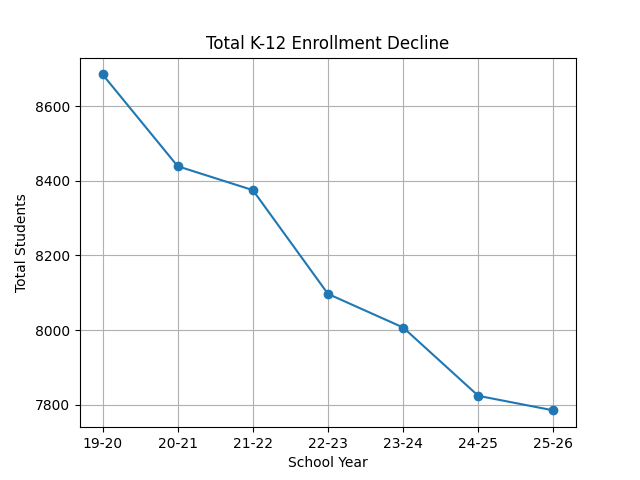
Across the reports, total K12 district enrollment has declined meaningfully since 2019–2020.
- ~8,685 students (2019–2020) Oct 1. 2019 K12 Enrollment
- ~7,785 students (2025–2026 )Oct 1. 2025 K12 Enrollment
That’s roughly a 10% decline.
Even more important:
This decline is not explained by population collapse alone.
What’s driving it?
- Open enrollment losses increasing significantly
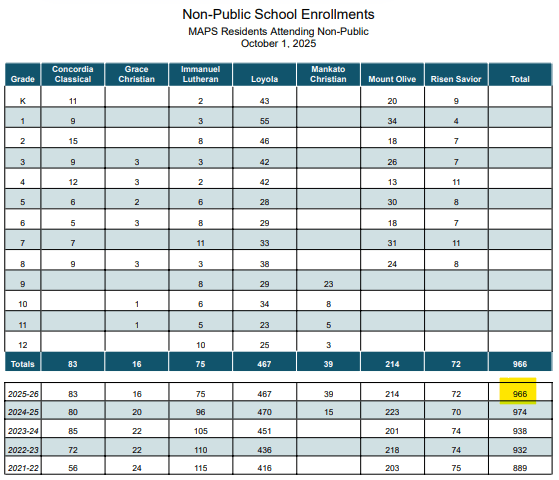
- Growth in private (non public) school enrollment (+23%)
- Continued homeschooling presence
This shows a shift in family choice behavior, not just demographics.
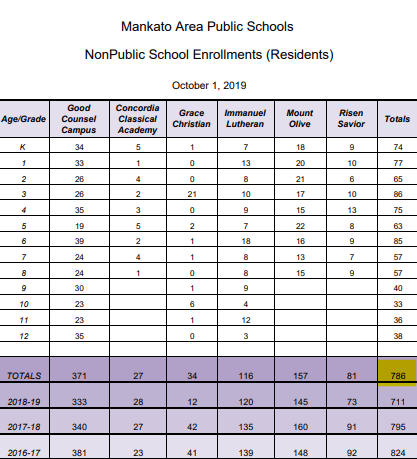
Non Public School Enrollment from 2019 and 2025
Open Enrollment: The Quiet but Critical Signal
One of the most consistent and under-discussed trends:
➡️ Mankato is losing more students to other districts than it is gaining.
Over time, this gap has widened significantly:
- ~119 net loss (2019–2020)
- ~600+ net loss (2024–2026 range)
This is one of the clearest indicators of:
Family mobility decisions
Perceived value differences
Program competition
The elementary trend
The elementary totals tell the story best.
- 2019–20: 4,084 enrolled
- 2020–21: 3,815
- 2021–22: 3,676
- 2022–23: 3,613
- 2023–24: 3,540
- 2024–25: 3,442
- 2025–26: 3,429
Takeaway: Elementary enrollment shows a clear, sustained decline over multiple years with no meaningful rebound.
The secondary trend
Secondary enrollment has been more stable, but still shows a gradual decline.
- 2019–20: 4,601 enrolled
- 2020–21: 4,624
- 2021–22: 4,699
- 2022–23: 4,484
- 2023–24: 4,467
- 2024–25: 4,382
- 2025–26: 4,356
Takeaway: Secondary enrollment remained stable initially but is now beginning to decline, following the same downward trend as elementary.
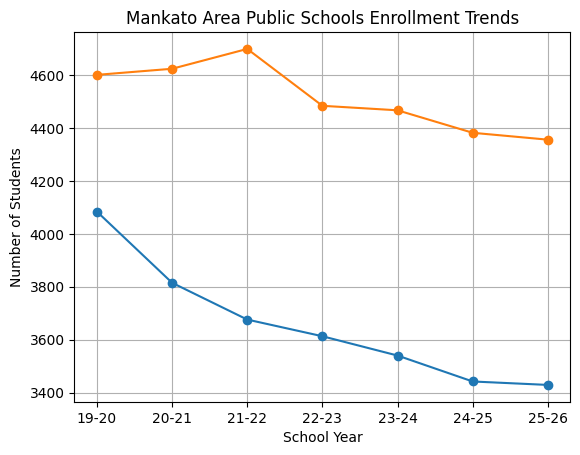
Orange Line is High School and Blue is Grade School Enrollment
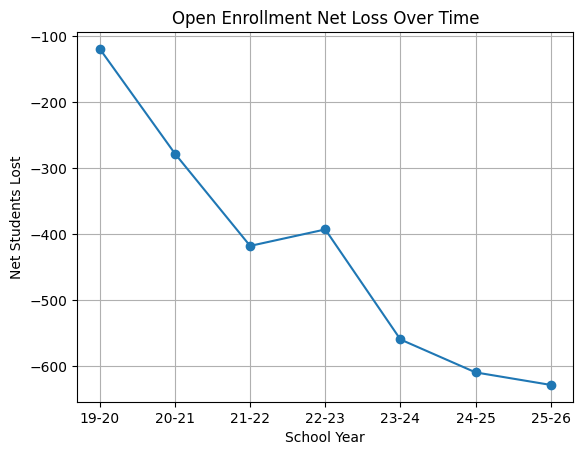
Open Enrollment: From Manageable Loss to Structural Challenge
Open enrollment has shifted from a modest imbalance to a significant and growing outflow. Over half of our overall enrollment drop is due to net loss of students.
- 2019–20: 415 in / 534 out → -119
- 2020–21: 424 in / 702 out → -278
- 2021–22: 376 in / 794 out → -418
- 2022–23: 395 in / 788 out → -393
- 2023–24: 315 in / 875 out → -560
- 2024–25: 329 in / 939 out → -610
- 2025–26: 296 in / 925 out → -629
This is one of the most important trends in the data.
These changes are not solely driven by demographics; they reflect family choice.
Even with the closure of Kato Public Charter School, the district continues to experience a net loss of students to other public schools.
From the 2025–26 Mankato Area Public Schools demographic data,
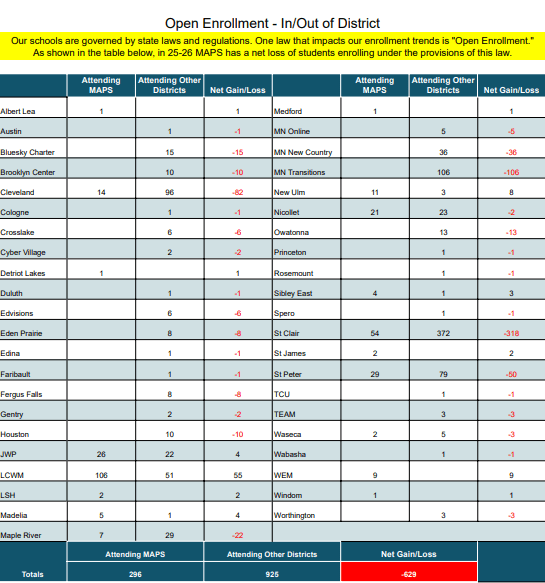
Where Students Are Going
The outflow is not random. Certain districts and programs appear consistently:
- St. Clair
- Cleveland
- St. Peter
- MN Transitions
- MN New Country
- Maple River
On the inbound side, Mankato draws from similar districts—but not in enough numbers to offset losses.
What this tells us:
This is not churn. It is a sustained competitive challenge.
What This Means
When you put these trends together, the picture becomes clear:
- Enrollment is declining
- Open enrollment losses are growing
- Elementary schools, in particular, are serving fewer students
This creates real pressure on:
- Staffing
- Transportation
- Programming
- Long-term financial sustainability
Buildings do not become less expensive simply because they are less full. And when students leave, funding follows them.
Moving Forward
At this point, it is clear these are not short-term fluctuations. The data reflects a sustained trend over multiple years.
Our responsibility now is to determine how we respond—thoughtfully, strategically, and transparently—in a way that best serves our students and community.
Source Links:

Leave a comment